- Home >> Toolkit >> Brainnetome Atlas
Brainnetome Atlas Viewer
Click here to Brainnetome atlas viewer!
Brainnetome Atlas Viewer shows the anatomical connectivity-based parcellation results, including the MPM maps,probabilistic maps and both the anatomical and functional connectivity patterns, which have been developed in the teams of in Brainnetome Center, CASIA. They are based on the analysis of connectional architecture with in vivo multi-modal MRI data during the last 3 years. The Brainnetome Center at CASIA is home of the Brainnetome Atlas Viewer. If you would like to download the atlas,please make sure you first read the legal agreement.
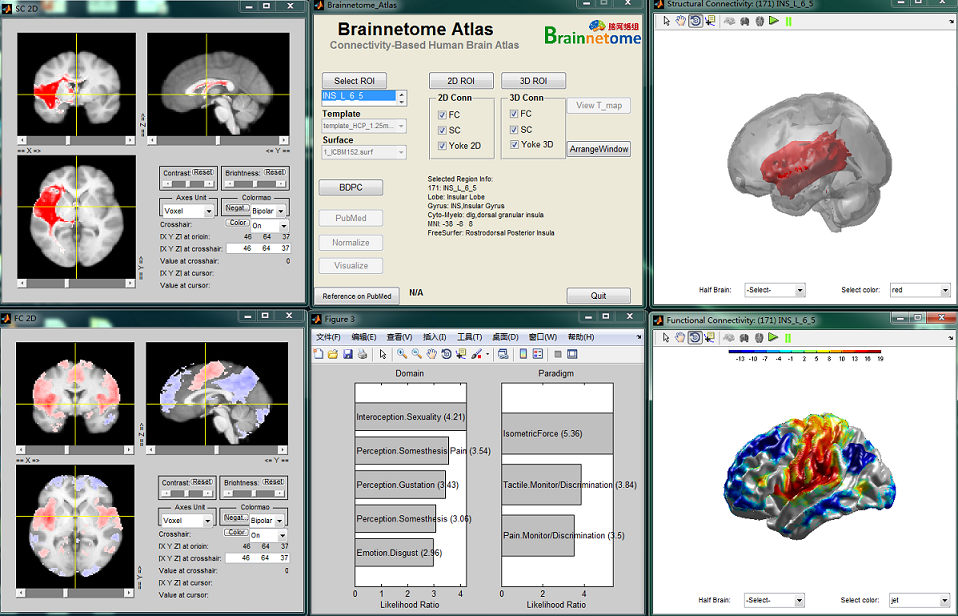
Brainnetome Atlas Viewer was developed using MATLAB with a user-friendly GUI. The toolkit included functions of NIfTI package for loading NIfTI and Analyze format files. This toolkit had been successfully tested under a variety of operating systems with MATLAB installed, including Windows, Linux (Ubuntu and CentOS). Brainnetome atlas Viewer was designed as the following procedure (see the Figure for a flowchart). First, users started the software in the command line of MATLAB. Then, an easy-to-use interface would show up, including the basic options for visualization of the atlas (such as the choice of background template). Users could view the whole atlas (maximum probabilistic map, MPM) and select a specific region for details. Subsequently, the toolkit would draw the selected region. If there were published papers about the selected region, users could visit the corresponding papers in Pubmed via the default browser. For the connectivity pattern for the region, users could check the activated checkboxes for functional/structural connectivity in two/three dimension. In addition, the brain region and connectivity pattern could be yoked together selected the corresponding checkbox. Finally, users could shut down any window by canceling the corresponding checkbox. For a specific brain region, Brainnetome atlas also provides the probabilistic map (PM) describing the frequency with which each voxel of the specific area was observed in the samples. The toolkit included the function for demonstrating the PM (using the specific probability as threshold to mask and save the PM; showing the corresponding label, from other atlas, of each voxel in PM).