- Home >> Latest News
A neuroimaging biomarker for striatal dysfunction in schizophrenia
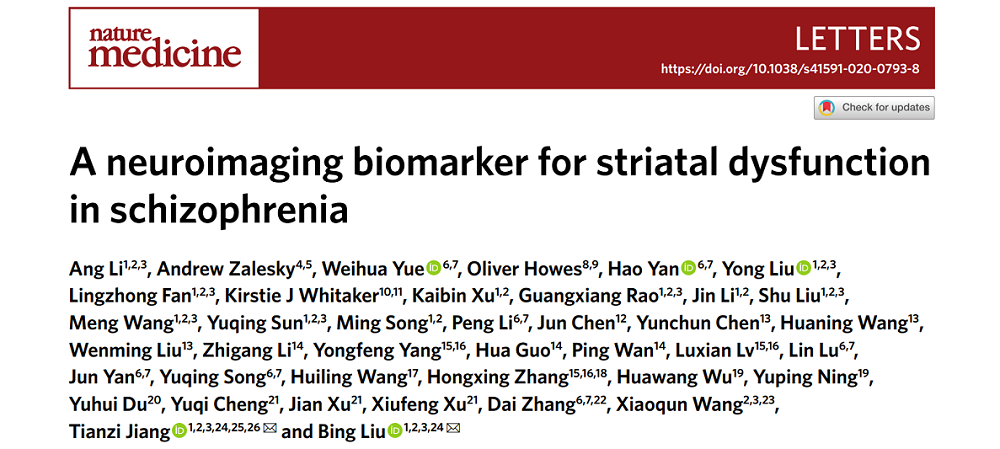
1. Brainnetome Center and National Laboratory of Pattern Recognition, Institute of Automation, Chinese Academy of Sciences, Beijing, China.
2. School of Artificial Intelligence, University of Chinese Academy of Sciences, Beijing, China.
3. Center for Excellence in Brain Science and Intelligence Technology, Chinese Academy of Sciences, Shanghai, China.
4. Melbourne Neuropsychiatry Centre, Department of Psychiatry, University of Melbourne and Melbourne Health, Melbourne, Victoria, Australia.
5. Department of Biomedical Engineering, University of Melbourne, Melbourne, Victoria, Australia.
6. Institute ofMental Health, Peking University Sixth Hospital, Beijing, China.
7. Key Laboratory of Mental Health, Ministry of Health, and National Clinical Research Center for Mental Disorders (Peking University Sixth Hospital), Beijing, China.
8. Psychiatric Imaging Group, MRC London Institute of Medical Sciences (Imperial College London), Hammersmith Hospital, London, UK.
9. Institute of Psychiatry, King’s College London, London, UK.
10. Department of Psychiatry, University of Cambridge, Cambridge, UK.
11. The Alan Turing Institute, British Library, London, UK.
12. Department of Radiology, Renmin Hospital of Wuhan University, Wuhan, China.
13. Department of Psychiatry, Xijing Hospital, The Fourth Military Medical University, Xi’an, China.
14. Zhumadian Psychiatric Hospital, Zhumadian, China.
15. Department of Psychiatry, Henan Mental Hospital, The Second Affiliated Hospital of Xinxiang Medical University, Xinxiang, China.
16. Henan Key Lab of Biological Psychiatry of Xinxiang Medical University, International Joint Research Laboratory for Psychiatry and Neuroscience of Henan, Xinxiang, China.
17. Department of Psychiatry, Renmin Hospital of Wuhan University, Wuhan, China.
18. Department of Psychology, Xinxiang Medical University, Xinxiang, China.
19. The Affiliated Brain Hospital of Guangzhou Medical University (Guangzhou Huiai Hospital), Guangzhou, China.
20. School of Computer and Information Technology, Shanxi University, Taiyuan, China.
21. Department of Psychiatry, First Affiliated Hospital of Kunming Medical University, Kunming, China.
22. Center for Life Sciences/ PKU-IDG/McGovern Institute for Brain Research, Peking University, Beijing, China.
23. State Key Laboratory of Brain and Cognitive Science, Institute of Biophysics, Chinese Academy of Sciences, Beijing, China.
24. Innovation Academy for Artificial Intelligence, Chinese Academy of Sciences, Beijing, China.
25. Key Laboratory for Neuro Information of Ministry of Education, School of Life Science and Technology, University of Electronic Science and Technology of China, Chengdu, China.
26. Queensland Brain Institute, University of Queensland, Brisbane, Australia.
Abstract
Mounting evidence suggests that function and connectivity of the striatum is disrupted in schizophrenia. We have developed a new hypothesis-driven neuroimaging biomarker for schizophrenia identification, prognosis and subtyping based on functional striatal abnormalities (FSA). FSA scores provide a personalized index of striatal dysfunction, ranging from normal to highly pathological. Using inter-site cross-validation on functional magnetic resonance images acquired from seven independent scanners (n?=?1,100), FSA distinguished individuals with schizophrenia from healthy controls with an accuracy exceeding 80% (sensitivity, 79.3%; specificity, 81.5%). In two longitudinal cohorts, inter-individual variation in baseline FSA scores was significantly associated with antipsychotic treatment response. FSA revealed a spectrum of severity in striatal dysfunction across neuropsychiatric disorders, where dysfunction was most severe in schizophrenia, milder in bipolar disorder, and indistinguishable from healthy individuals in depression, obsessive-compulsive disorder and attention-deficit hyperactivity disorder. Loci of striatal hyperactivity recapitulated the spatial distribution of dopaminergic function and the expression profiles of polygenic risk for schizophrenia. In conclusion, we have developed a new biomarker to index striatal dysfunction and established its utility in predicting antipsychotic treatment response, clinical stratification and elucidating striatal dysfunction in neuropsychiatric disorders.
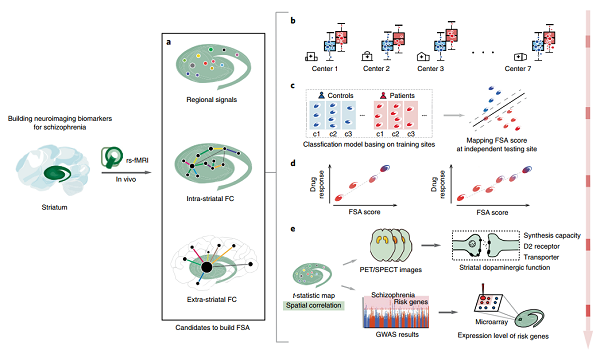 | Fig. 1 | Schema of development, testing and validation of the FSA biomarker. To establish a clinically useful resting-state (rs) fMRI biomarker, we addressed several major challenges: (1) obtaining reliable individualized measurements; (2) achieving reproducibility and generalizability across independent populations and sites; (3) achieving biological interpretability and mechanistic plausibility. a, The striatal features: based on our hypothesis, three distinct in vivo striatal imaging markers were included to systematically characterize striatal function. b, Group-level statistics: statistical analysis was performed for data acquired across multiple MR scanners and demonstrated reproducible FSA patterns. c, Individualized prediction of diagnosis: a machine learning model found generalizable predictive patterns of FSA and used them to predict unobserved diagnostic status in independent populations. Using the same classification models, FSA scores were mapped for each patient based on the confidence of the classification as a patient by the models. d, Individualized prediction of prognosis: the individualized FSA score predicted the diversity of short-term antipsychotic response in independent populations. e, Neurobiological and genetic insights: spatial patterns of elevated striatal spontaneous brain activity were investigated using complementary analyses of molecular imaging and transcriptomic data, revealing a significant spatial association between striatal dopaminergic function and the expression profiles of schizophrenia risk genes. GWAS, genome-wide association study. |
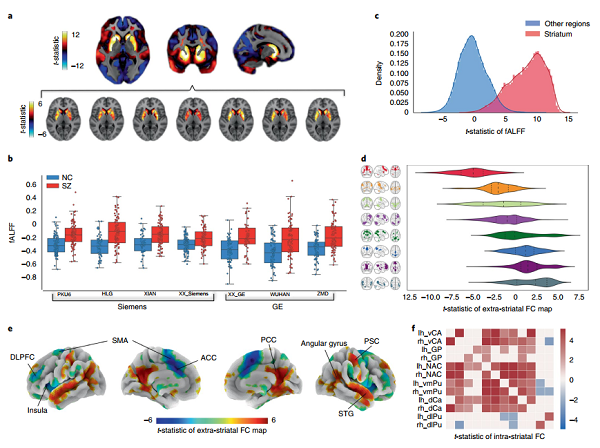 | Fig. 2 | Striatal dysfunction in schizophrenia assessed with resting-state fMRi acquired at multiple independent sites. a, Map of t-statistic values for between-group difference in fALFF (schizophrenia group minus control group; unpaired two-sided t-test); b, Scatter-box chart of the mean fALFF in the striatum of normal controls (NC, blue) and schizophrenia groups (SZ, red) across different scanners. c, Gaussian kernel density estimation of fALFF t-statistic values for voxels comprising the striatum (red) and non-striatal regions (blue). d, Violin plot of t-statistic values across networks that are abnormally connected with the striatum in schizophrenia. e, Cortical rendering of regions showing abnormal FC with the striatum (FDR corrected, P < 0.05; unpaired two-sided t-test). f, Matrix of t-statistic values for between-group differences in FC between 12 striatal subregions. |